Wireshark is one of the most powerful tools when it comes to network traffic analysis. This is the introduction article to the new Wireshark Tutorial Series – Starting from scratch and finishing off with you being able to pro-efficiently analyse and understanding the traffic flowing through your network.
Without too much talk about the history of Wireshark, you have probably heard of it before or even used it before. Wireshark is a powerful tool to analyse traffic going through your network.
Things you will learn in this series:
- How to properly operate Wireshark
- Use filters
- Analyse traffic like HTTP, FTP, DNS, SMTP
- How to read traffic output
- And many more things
I try to make this series as easy as possible. Also, I will try to keep it as short as possible, so I will not explain what DNS does for example, this is up to your own research.
But before we start –
DISCLAIMER: Wireshark is a tool to analyse network traffic and can only be used in a testing environment that you have full control of, or with a signed contract that specifically allows you to sniff a network (Your workplace for example.) ceos3c will not take any responsibility if you abuse the skills you learn here for illegal activity.
1. Our lab environment
For our lab environment we will keep it rather simple to not make things more complicated than necessary.
I recommend you use VirtualBox. In case you mess up, you can always revert back to a working snapshot.
We will start off with a simple network diagram, which we will extend a bit later on:
This is what we will start off with. As our Wireshark computer, we will use Kali Linux on VirtualBox. Wireshark comes pre-installed on it.
You can also use your Windows computer to run Wireshark on.
If you don’t know how to install Kali Linux on VirtualBox, we got you covered.
Ok, let’s talk about what you can do with Wireshark.
2. What can Wireshark do?
Let’s quickly run through a couple of main features that Wireshark provides:
- Network Analysis:
- Who communicates with who
- Which host uses which software
- Who sends connection requests
- Analysis bandwidth usage
- Identify background noise
- Troubleshooting:
- Identify TCP Problems
- Find malfunctions in the network
- Find duplicate IP addresses
- Software analysis:
- Which protocol is used by which software
- Measure bandwidth usage of certain softwares
- Security analysis:
- Analysis Ports
- Analyse suspicious communications
- Analyse telemetry
That’s just a few things among many others you can do with Wireshark.
3. Preparing Kali Linux to use Wireshark
If you use Wireshark on Windows, you can skip this step and continue with step 4. On Windows you simply run through the installer, leaving everything on default.
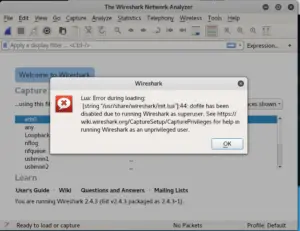
Wireshark comes pre-installed on Kali, although, when you start it, it will give you an error message regarding the Lua script. This is because we run Wireshark as a Super User (Root). We could fix this simply by creating a non-root user or, by disabling the Lua engine, which we don’t need for the scope of this tutorial.
We are going to disable the engine.
Open a Terminal window by pressing the Windows Key and typing Terminal or by clicking on the Terminal icon on the left taskbar.
Type:
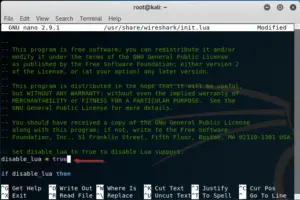
nano /usr/share/wireshark/init.lua
Scroll all the way down until you find:
disable_lua = false
Press CTRL + O to save and CTRL + X to exit.
Start Wireshark again and you will see that the error message doesn’t appear again.
4. Wireshark GUI overview
Alright, since we have everything up and running now, it’s time to get a feeling for the GUI. The GUI on Windows and Linux is mostly the same, so this applies for both versions.
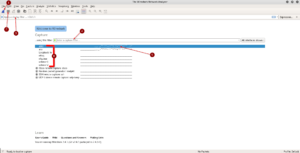
You can see the most important points indicated by numbers, let’s quickly run through them:
- Starts capturing packets
- Stops capturing packets
- Lets you apply a display filter after capturing packets, to only show packets with port 53 for example
- Lets you apply a capture filter that directly filters out undesired traffic while you capture
- A bandwidth graph indicating bandwith volume on the network interface
- All available interfaces
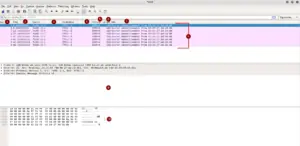
After we start capturing packets, the GUI immediately changes over to the packet capture window. Let’s run through numbers again, indicating the most important fields:
- Number of captured package/frame
- Time of capturing in seconds
- Source of the frame
- Destination of the frame
- Used Protocol (There would be written stuff like HTTP, DNS and so forth if applicable)
- Length of the frame
- Summary of what the frame / package does
- Captures packages / frames
- Details of selected frame, extendable, more later
- Raw data in hexadecimal on the left, readable or unreadable info on the right, depending on the frame
All the columns up there like Time and so forth can be adjusted extensively and a lot of other different columns can be added. I will show you how to do that later on in the tutorial.
You also see that I always said packages or frames. The correct term or mostly used term in that regard would be frames. So from now on we will refer to those “packages” as frames only.
Alright, this should give you a pretty good overview of the basic functions of Wireshark. Feel free to play around and click-through the menus and captured frames to get a feeling for how everything works.
I want to deliver this tutorial portion sized so you have actual time to look into what you learned before rushing through everything at once.
Next part will be up next week.
Let me know in the comments below if you would like to see more Wireshark goodness!


